Points on a
Graph
Objectives
After reviewing this unit you will be able to:
- Identify the x and y axes.
- Identify the origin. on a graph.
- Identify x and y coordinates of a point.
- Plot points on a graph.
Elements of a Graph
We often use graphs to give us a picture of the
relationships between variables. Let's first look at the basic
construction of graphs.
- A graph is a visual representation of a relationship
between two variables, x and y.
- A graph consists of two axes called the x (horizontal)
and y (vertical) axes. These axes correspond to the variables
we are relating. In economics we will usually give the axes different
names, such as Price and Quantity.
- The point where the two axes intersect is called the origin.
The origin is also identified as the point (0, 0).
|
 |
Coordinates of Points
A point is the basic relationship displayed on a graph. Each point
is defined by a pair of numbers containing two coordinates. A coordinate is one of a set of numbers
used to identify the location of a point on a graph. Each
point is identified by both an x and a y coordinate.
In this unit you will learn how to find both coordinates for any
point. You will also learn the correct notation for labeling the
coordinates of a point. You will first begin by identifying the
x-coordinateof a point.
Identifying the x-coordinate
The x-coordinate
of a point is the value that
tells you how far from the origin the point is on the horizontal,
or x-axis. To find the x-coordinate of a
point on a graph:
- Draw a straight line from the point directly
to the x-axis.
- The number where the line hits the x-axis
is the value of the x-coordinate.
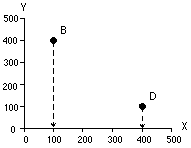
At the right is a graph with two points, B and D. In this
figure:
- The x-coordinate of point B is 100.
- The x-coordinate of point D is 400.
|

|
Identifying the y-coordinate
As we already mentioned, each point is defined by two coordinates,
the x and the y coordinate. Now that you know how
to find the x-coordinate of a point, you have to be able
to find the y-coordinate. The
y-coordinate
of a point is the value that tells you how far from the origin
the point is on the vertical, or y-axis. To find
the y-coordinate of a point on a graph:
- Draw a straight line from the point directly
to the y-axis.
- The number where the line hits the axis is the
value of the y-coordinate.
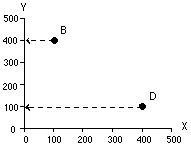
Looking back at the graph with our points B and D, we now
identify the y-coordinate for each.
- The y-coordinate of point B is 400.
- The y-coordinate of point D is 100.
|

|
Notation for Identifying Points
Once you have the coordinates of a point you can use the ordered
pair notation for labeling points. The notation is simple. Points
are identified by stating their coordinates in the form of (x,
y). Note that the x-coordinate always comes
first. For example, in the figure we've been using, we have identified
both the x and y coordinate for each of the points
B and D.
- The x-coordinate of point B is 100.
- The y-coordinate of point B is 400.
- Coordinates of point B are (100, 400)
- The x-coordinate of point D is 400.
- The y-coordinate of point D is 100.
- Coordinates of point D are (400, 100)
|

|
Points On The Axes
If a point is lying on an axis, you do not need to draw lines
to determine the coordinates of the point. In the figure below,
point A lies on the y-axis and point C lies on the x-axis.
When a point lies on an axis, one of its coordinates must be zero.
- Point A--If you look at how far the point is
from the origin along the x-axis, the answer is zero.
Therefore, the x-coordinate is zero. Any point that lies
on the y-axis has an x-coordinate of zero.
If you move along the y-axis to find the y-coordinate,
the point is 400 from the origin. The coordinates of point A
are (0, 400)
|

|
- Point C--If you look at how far the point is
from the origin along the y-axis, the answer is zero.
Therefore, the y-coordinate is zero. Any point that lies
on the x-axis has a y-coordinate of zero.
If you move along the x-axis to find the x-coordinate,
the point is 200 from the origin. The coordinates of point C
are (200, 0)
Example
- Which point is on the y-axis?
- Which point is labeled (20, 60)?
- Which point(s) have a y-coordinate
of 30?
|
 |
Answers to Example
- Which point is on the y-axis?
Point A
- Which point is labeled (20, 60)?
Point B
- Which point(s) have a y-coordinate
of 30? Points A & C

[solution to example]
Plotting Points on a Graph
There are times when you are given a point and will need to find
its location on a graph. This process is often referred to as
plotting a point and uses the same skills as identifying the coordinates
of a point on a graph. The process for plotting a point is shown
using an example.
Example
Plot the point (200, 300).
|
Step One |
Step Two |
Step Three |
|
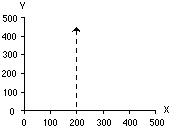
First, draw a line extending out from the x-axis at the
x-coordinate of the point. In our example, this is at
200. |
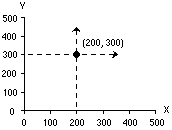
Then, draw a line extending out from the y-axis at the
y-coordinate of the point. In our example, this is at
300. |
The point where these two lines intersect is at the point we
are plotting, (200, 300). |

|

|

|
You are now ready to try a practice problem. If you have already
completed the first practice problem for this unit you may wish
to try the additional practice.