Mathematics and Non-Math Courses
In introductory courses such as chemistry, economics, political
science, and psychology, many relationships are represented graphically.
You will often use graphs to make interpretations about what is
happening in a relationship or construct graphs to describe an
economic relationship.
While the examples below are taken directly from different
economics textbooks, they demonstrate the kinds of skills that
you will be required to use in many non-math introductory courses.
Example

|
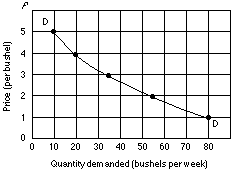
FIGURE 1: An individual buyer's demand curve for corn
An individual's demand schedule graphs as a downsloping curve
such as DD, because price and quantity demanded are inversely
related. Specifically, the law of demand generalizes that consumers
will buy more of a product as its price declines.
Adapted from: McConnell, C. R. & Brue, S. L. (1996) Macroeconomics:
Principles, problems and policies (pp. 40 & 41). New York: McGraw-Hill.
|
Figure 1 above shows an individual buyer's demand curve for
corn. From this graph you should be able to determine the price
per bushel for any given quantity demanded (in bushels per week).
To do this you must be able to correctly plot points on a graph.
Example

|
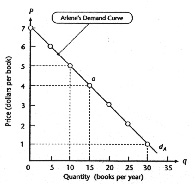
FIGURE 2 An Individual's
Demand Curve for Paperback Books
Arlene's demand for paperbacks can be shown by a curve or
a schedule. Demand reflects an individual's willingness to buy
various quantities of a good at various prices. A demand curve's
negative slope reflects the law of demand, in this case,
Arlene's buys more books at lower prices.
Adapted from: Byrns, R. T. & Stone, G. W. (1995) Microeconomics
(p. 63). New York: Harper Collins College Publishers. |
Figure 2 above shows another demand curve for price versus
quantity. Again, you will need to be able to determine, for example,
what the price of books will be if the quantity is 10. This involves
using the graph skills presented in this section.
The skills you will learn in this section are:
- Define the terms constant and variable.
- Identify whether an item is a constant or a variable.
- Identify whether an item is a dependent or independent
variable.
- Identify the x and y axes.
- Identify the origin on a graph.
- Identify x and y coordinates of a point.
- Plot points on a graph.