Equations and
Their Graphs
Objectives
After reviewing this unit, you will be able to:
- Draw a graph from a given equation.
- Determine whether a given point lies on the graph
of a given equation.
Graphing an Equation
In section one we introduced an example using the cost of pizza
based on the number of toppings on the pizza. In this example,
a plain pizza with no toppings was priced at 7 dollars. As you
add one topping, the cost goes up by 75 cents. (If you wish to
review the example, return to the first
unit.) We found the equation that relates the total price
of a pizza to the number of toppings on the pizza to be y
= 7.00 + .75x. Now let's look at how you can draw a graph
that illustrates this relationship. The procedure for doing this
is:
- Generate a list of points for the relationship.
- Draw a set of axes and define the scale.
- Plot the points on the axes.
- Draw the line by connecting the points.
Now let's work through these steps with our pizza example:
- 1. Generate a list of points for the relationship.
The first step in the process is to generate a list of points
to graph. You do this by selecting several values for thex
coordinate. You should always make sure you find at least three
points to graph. (NOTE: Using three points serves as an extra
check that you have done all the calculations correctly. All
three should lie on the same straight line.) Once you have selected
at least three values for x, use the equation to
calculate their correspondingy values. While you are doing
this you should display the information in a table.
In the pizza example, the equation is y = 7.00 + .75x.
You first select values ofx you will solve for. You then
substitute these values into the equation and solve for they
values. Your list of points may be kept in a table like the one
below. For our pizza example, a table may start out this way:
x
Number of Toppings |
y
Final Cost |
|
0 |
7.00 |
|
1 |
7.75 |
|
2 |
|
|
3 |
|
|
4 |
|
In the table below, for each givenx value you can see
the calculation of each of they values.
|
x
Number of Toppings |
y
Final Cost |
Let x = 0: y = 7.00
+ .75 (0)
y = 7.00 + 0
y = 7.00 |
0 |
7.00 |
Let x = 1: y = 7.00
+ .75 (1)
y = 7.00 + .75
y = 7.75 |
1 |
7.75 |
Let x = 2: y = 7.00
+ .75 (2)
y = 7.00 + 1.50
y = 8.50 |
2 |
8.50 |
Let x = 3: y = 7.00
+ .75 (3)
y = 7.00 + 2.25
y = 9.25 |
3 |
9.25 |
Let x = 4: y = 7.00
+ .75 (4)
y = 7.00 + 3.00
y = 10.00 |
4 |
10.00 |
After you have completed your table, you should end up with
the following list of points:
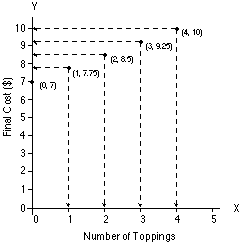
(0, 7.00) , (1, 7.75), (2, 8.50), (3, 9.25), (4, 10.00)
Notice they are written using the (x, y) notation.
You are now ready to create the graph of these points on a set
of axes.
- 2. Draw a set of axes and define
the scale.
|
Once you have your list of points you are ready to plot them
on a graph. The first step in drawing the graph is setting up
the axes and determining the scale. The points you have to plot
are:
(0, 7.00), (1, 7.75), (2, 8.50), (3, 9.25), (4, 10.00)
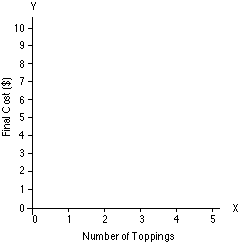
Notice that thexvalues range from 0 to 4 and theyvalues
go from 7 to 10. The scale of the two axes must include all the
points. Below is a set of axes drawn to do just that. Notice
that the distance between the points must be equal on each axis
but does not have to be the same for both axes. The x-axis
goes up to 5 on this diagram, and the y-axis up to 10;
the scale on each axis can be different. |

|
- 3. Plot the points on the axes.
|
After you have drawn the axes, you are ready to plot the points.
(How to plot points was discussed in the first part of this book.
If you feel you need to review this, reread the discussion on
plotting points in the second unit.)
Below we plot the points on a set of axes. |

|
- 4. Draw the line by connecting the
points.
|
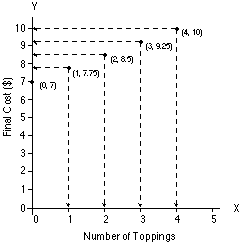
Once you have plotted each of the points, you can connect them
and draw a straight line. |

|
Checking
a Point in the Equation
If, by chance, you have a point and you wish to determine if it
lies on the line, you simply go through the same process as generating
points. Use the x value given in the point and insert it
into the equation. Compare the y value calculated with the
one given in the point.
Example
Does point (6, 10) lie on the line y = 7.00 + .75 x
given in our pizza example? To determine this, we need to plug
the point (6, 10) into the equation.
|
x
Number of Toppings |
y
Final Cost |
Let x = 6
y = 7.00 + .75 (6)
y = 7.00 + 4.50
y = 11.50 |
6 |
11.50 |
As we can see here, the point with an x value of 6 that
does lie on the line is (6, 11.5). This means that the point
(6, 10) does not lie on our line.
You are now ready to try graphing an equation. Move on to the
first practice for this unit. If you have already completed the
first problem try the additional pratice before moving on.