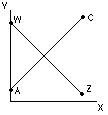
In this graph, there are two relationships between the x
and y variables; one represented by the straight line
Notice in this graph each line is labeled by its endpoints.
For example, the notation of
After reviewing this section you will be able to:
Many times in the study of economics we have the situation where there is more than one relationship between the x and y variables. You'll find this type of occurrence often in your study of supply and demand.
|
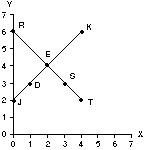
In this graph, there are two relationships between the x
and y variables; one represented by the straight line
Notice in this graph each line is labeled by its endpoints.
For example, the notation of |
|
In the following graph,
|
Notice that there are several points on the graph. In all but one instance, the same y value corresponds to different x values on each line. For instance, each line in the graph has a point with a y-value of 3:
|
 |
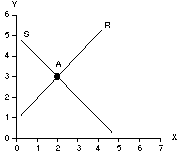
In one case, the two lines have the same (x, y)
values simultaneously. This is where the two lines
In your economics class you will be asked to draw conclusions from information presented in graphs where a line has shifted positions. It is important to be able to interpret what is happening on a graph after a shift occurs. You will typically be asked what happens to the intersection point of two lines when one of them shifts. In any situation where you are given a shift in a line:
| Before the Shift | After the Shift |
|---|---|
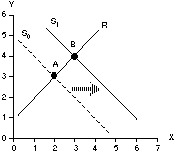
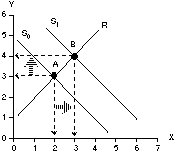
| This graph contains the two lines R and S, which intersect at point A (2, 3). Lines shifts to the right. (NOTE: Notice we are using a single letter here to label the lines.) What happens to the intersection of the two lines if one of the lines shifts? | Before attempting to answer this question, we should look at a graph that illustrates this scenario. On the graph below, line S0 is our original line S. Lines S1 represents our new S after it has shifted. The new point of intersection between R and S is now point B (3, 4). |
 |
 |
|
Compare the points A (2, 3) and B (3, 4) on this graph.
Both the x and y coordinates increased as the line S shifted to the right. This is only one type of shift, a shift to the right. However, the same procedure is used to examine any shift. |
 |
You are now ready to try a practice problem. If you have already completed the first practice problem for this unit you may wish to try the additional practice.
|
|
|
|
|
| [practice] | [additional practice] | [table of contents] | [next unit] |