Linear Relationships
One of the most basic types of relationships is the linear
relationship. Many graphs in introductory courses such as chemistry,
economics, political science, and psychology will display linear
relationships, and you will need to use graphs to interpret what
is happening. There are several components of relationships that
can be quickly determined from a graph once you know what to look
for.
Below are examples taken directly from different economics
textbooks. These examples demonstrate the types of skills you
will be required to know and use in many non-math introductory
courses.
Example

|
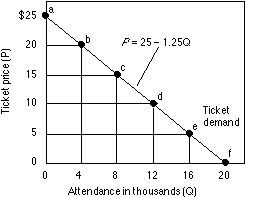
FIGURE 1: Graphing
the inverse relationship between ticket prices and game attendance.
Two sets of data which are negatively or inversely related,
such as ticket price and the attendance at basketball games,
graph as a downsloping line.
The slope of this line is -1.25
Adapted from: McConnell, C. R. & Brue, S. L. (1996) Macroeconomics:
Principles, problems and policies (p. 15). New York: McGraw-Hill. |
Figure 1 above shows the relationship between ticket prices
and attendance. From this graph you can see that this is a linear
relationship where attendance will go down as ticket prices go
up. This graph allows you to determine how much you should charge
for a ticket. Using this graph involves an understanding of linear
relationships and how to graph equations of straight lines.
Example

|
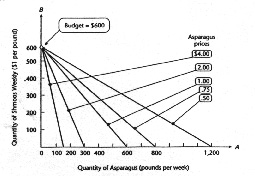
FIGURE 2: Budget
lines for $600 income with various prices for asparagus.
All else being equal, as the price of asparagus falls, the
budget line expands and becomes less and less steep. This reflects
the declining price of asparagus relative to its alternatives.
Alternatively, as the price of asparagus rises, less and less
can be purchased if the entire budget is spent on asparagus.
Adapted from: Byrns, R. T. & Stone, G. W. (1995) Microeconomics
(p. 143). New York: Harper Collins College Publishers. |
Figure 2 above shows a more complex relationship involving
prices of asparagus and budget lines. Here we can see how the
price of asparagus affects the quantity of different foods that
can be purchased. Understanding this relationship and what this
graph shows involves using the graph skills presented in this
section.
The skills you will learn in this section are:
- Draw a graph from a given equation.
- Determine whether a given point lies on the graph of a given
equation.
- Define slope.
- Calculate the slope of a straight line from its graph.
- Be able to identify if a slope is positive, negative, zero,
or infinite.
- Identify the slope and y-intercept from the equation
of a line.
- Identify y-intercept from the graph of a line.
- Match a graph with its equation.