Detailed
Answers to Additional Practice:
Equations and Their Graphs
Now let's
work through the solution to this problem by going through the
steps outlined in this unit. The equation you should have graphed
is:
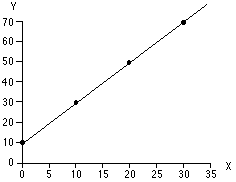
y = 2x + 10
- Generate a list of points for the
relationship.
|
You should have created a table to obtain some points. A sample
using 0, 1, 2, and 3 for x is shown in the table.
To obtain y values, plug the x values into the
equation y = 2x + 10 and compute. |
|
x |
y |
|
0 |
10 |
|
10 |
30 |
|
20 |
50 |
|
30 |
70 |
|
x = 0
y = 2 (0) + 10
y = 0 + 10
y = 10 |
x = 10
y = 2 (10) + 10
y = 20 + 10
y = 30 |
x = 20
y = 2 (20) + 10
y = 40 + 10
y = 50 |
x = 30
y = 2 (30) + 10
y = 60 + 10
y = 70 |
The points that we have defined here are:
(0, 10), (10, 30), (20, 50), (30. 70)
- Draw a set of axes and define the
scale.
This part was done for you in the problem. Copy the axes provided
in the practice problem.
- Plot the points on the axes.
Next, plot the following points (0, 10), (10, 30), (20, 50),
(30. 70) on a set of axes.
NOTE: Regardless of
the points you selected, your graph of the line will still be
the same.
- Draw the line by connecting the
points.
Once you have plotted the points, connect them to get a line.
|

|
What if your graph does not look like
this?
If your graph does not look like the one shown here, read
through the suggestions below to determine where you may have
made a mistake.
If any of your points do not lie on your straight line:
- Check your calculations for an error in computing y values.
Check our calculations to be sure they are correct.
- Remember that points are given in the coordinate notation
of (x, y), with x first and y second.
- Check to be sure all of your points are plotted correctly.
IMPORTANT:
You should always plot at least
three points before drawing your line. This serves as an
extra check because if one points does not lie on your line, you
made a mistake somewhere.
If you understand this solution, then move into the next unit.
If you still do not understand how to graph the equation of a
straight line, you may need more review than is offered by this
book. If this is the case, please speak with your professor for
suggestions on how to get help.